Introduction
Date Time fields in SharePoint lists are crucial for tracking key information. However, SharePoint's default tools can lack clarity, especially when differentiating between two date time fields. Fortunately, SharePointDashboards.com offers a robust solution to this challenge. By using their tools, you can visualize the difference between date time fields in a user-friendly way. This article explores how SharePoint Dashboards can enhance team communication, streamline project approvals, and improve overall status tracking.
Charting and Visual Status Indicators
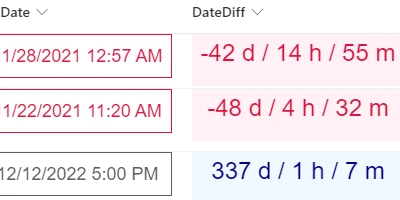
Leveraging the date time difference templates from SharePointDashboards.com allows teams to transform raw data into actionable insights. With several formatting options, teams can select styles that suit their preferences, including colors, borders, and font styles. These visual enhancements make it easier to grasp project timelines and deadlines at a glance.
These visual status indicators are integral to charting as they provide real-time updates on project progress. By prominently displaying the time difference between project milestones, teams can quickly identify lagging tasks, allocate resources efficiently, and make informed decisions.
Project Approvals
In corporate settings, project approvals often require a clear understanding of timelines. Visualizing the date differences between approval stages can speed up decision-making processes. With SharePoint Dashboards, not only can the time between project phases be displayed, but stakeholders can also be notified promptly about pending approvals or delays. This streamlined approach reduces bottlenecks and facilitates smoother project progression.
Employee Management and Status Tracking
For HR and management teams, understanding employee schedules and tracking performance is crucial. By utilizing SharePoint Dashboards to show the difference between key date fields, managers can quickly assess employee schedules, track project contributions, and anticipate workloads. A prominent display of these date differences allows for better planning and workload distribution, leading to improved employee performance and satisfaction.
Enhanced Team Communication with Shared Dashboards
A shared dashboard fosters better communication within teams by providing a single source of truth. By making the difference between date time fields visible, team members can align more easily on priorities and deadlines. This shared access ensures that everyone is on the same page, minimizing miscommunication and enhancing collaboration. With dashboards showcasing real-time data, teams can conduct more productive meetings and reduce the time spent on status updates.
Easy Setup with SharePointDashboards.com
Setting up these advanced dashboards with a Date Difference template is straightforward. The template is one of hundreds offered at SharePointDashboards.com, simplifying the process substantially. Users only need to select their desired format options, adjust the settings to their preference, and copy-paste the template into their SharePoint list. This ease of use ensures that even teams with limited technical expertise can benefit from enhanced data visualization.
SharePoint JSON Formatting
A key feature of SharePoint lists is the ability to apply JSON formatting to customize the list view. Using templates from SharePointDashboards.com, JSON formatting can be easily applied to show date time differences clearly. By copying a pre-defined template and applying it to your SharePoint list view, you can radically transform how date differences are displayed. This customization not only improves aesthetic appeal but also increases functional efficiency by making critical data more accessible.
Use Case Scenarios
Numerous scenarios can benefit from enhanced date time visualizations:
- Project Management: Team leads can use SharePoint dashboards to monitor task durations against deadlines.
- HR Management: Managers can display time-lapsed between training sessions and subsequent evaluations, enabling them to track employee development.
- Customer Service: By displaying the difference between complaint receipt and resolution date, customer service teams can improve service levels.
- Logistics: Compare the time taken between dispatch and delivery to optimize supply chain performance.
In each scenario, the ability to display date time differences changes how teams interact with data and make decisions, leading to improved operational effectiveness.
Conclusion
In today's fast-paced work environment, efficient communication and streamlined processes are key to any organization's success. Using SharePoint dashboards to visualize date time differences represents a leap forward in data interaction. By employing simple, customizable templates from SharePointDashboards.com, teams can enhance their charting, status indicators, project approvals, and employee management. This not only facilitates better decision-making but also aligns team efforts towards shared goals. Get started today by visiting
SharePointDashboards.com and discover how you can leverage these tools to enhance your organizational efficiency.