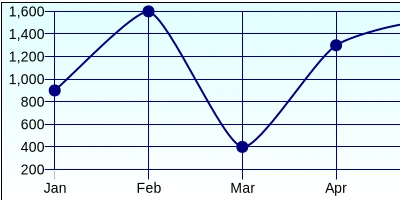
Enhancing SharePoint with Advanced Charting Tools
In today's fast-paced digital workplace, effective communication, project management, and data visualization are vital components of a successful organization. While SharePoint Online excels in team collaboration and document management, it falls short in providing robust charting tools. Fear not, for SharePointDashboards.com has come to the rescue with its expansive suite of over 35 charting templates. These templates can be seamlessly integrated into your SharePoint site to enhance data visualization and streamline communication within your organization.
Charting in SharePoint: A Game Changer for Teams
The ability to visualize data through charts is crucial for any organization aiming to transform complex data into actionable insights. SharePointDashboards.com offers an array of charting templates that empower businesses to represent SharePoint list data visually without the need for additional software installations. By utilizing these templates, companies can manage and visualize project data, employee performance, and other critical metrics in an intuitive and aesthetically pleasing manner.
Advancing Project Management and Approval Processes
A project's success often hinges on effective communication and transparency. By setting up a shared dashboard using SharePointDashboards.com templates, companies can significantly enhance project management processes:
- Visual Status Indicators: Charts provide clear visual cues regarding project status, offering real-time insights into project progress.
- Project Approvals: By visualizing approval processes, stakeholders can quickly gauge pending tasks, facilitating swift decision-making and approvals.
- Employee Management: Managers can track performance metrics and workloads effortlessly with charts, enabling better allocation of resources and enhanced productivity.
- Status Tracking: Team members can see current progress, bottlenecks, and next steps. This transparency ensures everyone aligns with project goals.
Fostering Communication with a Shared Dashboard
A shared dashboard is more than just a collection of charts; it's a communication powerhouse. Teams communicate more effectively when they have a centralized, accessible area to view real-time project data. With SharePointDashboards.com, setting up such a dashboard is a breeze. The ability to quickly relay critical information through visualizations ensures teams are on the same page, reducing the chances of miscommunication and enhancing collective focus.
Easy Setup with SharePointDashboards.com
The beauty of SharePointDashboards.com lies in its simplicity. There's no need for advanced technical skills. Here's how you can set up your own charting dashboard:
1. Browse through over 35 charting templates available at
SharePointDashboards.com.
2. Customize your chart's settings to align with your organization's branding and data requirements.
3. Simply copy the JSON template provided for the desired chart and paste it into your SharePoint site.
The step-by-step simplicity ensures that anyone, regardless of their technical background, can set up a dynamic and visually appealing dashboard within minutes.
Use Case Scenarios: Keeping Team Members Updated
There are numerous scenarios where these charting templates can be invaluable:
- Project Updates: Weekly team meetings can be more productive by displaying up-to-the-minute project statuses through updated charts.
- Quarterly Reviews: High-level presentations to stakeholders can include visual data insights drawn directly from SharePoint lists, increasing clarity and impact.
- Department Metrics: Monthly departmental dashboards can highlight achievements, challenges, and areas for improvement, facilitating focused strategy sessions.
- Employee Performance: HR teams can use dashboards to monitor KPIs, motivation metrics, and performance reviews in a visually compelling format.
Understanding SharePoint JSON Formatting
One of the core components enabling this visual transformation is SharePoint JSON formatting. JSON (JavaScript Object Notation) formatting is used to alter the appearance and behavior of SharePoint list views. By integrating a pre-designed JSON template from SharePointDashboards.com, you can swiftly transform plain list data into captivating charts.
Applying a JSON template involves the following steps:
- Navigate to the list view you wish to modify.
- Access the view formatting panel and apply the JSON code from the chosen template.
- Instantly see your list data transform into a visual chart, ready to share with your team.
This method of applying JSON formatting ensures a powerful, code-free approach to enhancing SharePoint list views with rich visual content.
The Power of Data Visualization
Data visualization helps decode complex datasets, turning them into understandable and actionable insights. By utilizing the charting templates on SharePointDashboards.com, companies leverage a powerful tool to communicate with clarity and transparency. This improved communication leads to better decision-making, increased productivity, and a more cohesive team dynamic.
In conclusion, while SharePoint Online may lack advanced built-in charting tools, the solutions offered by SharePointDashboards.com provide a user-friendly, efficient, and visually appealing toolset. By transforming data visualization capabilities, organizations can foster improved communication, drive decision-making, and enhance team collaboration-paving the way for successful project management and beyond.


