Understanding the Importance of Flow Charts in Business Processes
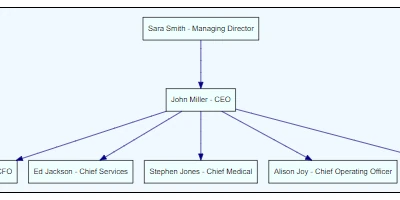
Flow charts are a pivotal tool in illustrating complex processes in a clear, visual manner. They serve as a bridge that connects the abstract elements of a task to actionable steps that can be easily interpreted by employees across all levels. By representing procedures graphically, organizations can streamline their workflows, enhance communication, and ensure that all team members are on the same page. The question then becomes: what is the most efficient way to integrate flow charts within popular platforms like SharePoint?
Effective Flow Charts within SharePoint
Utilizing SharePoint for creating and managing flow charts delivers seamless integration with other business processes. SharePointDashboards.com offers an innovative solution with its Flow Chart template, which makes the creation of these charts straightforward by leveraging data directly from SharePoint lists. To set it up, users only need to enter the necessary steps and configuration details, then simply copy and paste a custom template from SharePointDashboards.com to their SharePoint list.
Customization Options with SharePointDashboards.com
One of the most compelling features of the SharePointDashboards.com Flow Chart template is its broad range of customization options. Users have control over various aspects of their flow charts, such as colors, backgrounds, fonts, and shapes. These options enable teams to tailor their charts to fit the branding or particular needs of the organization. Once these customizations are set, the template can be easily applied, providing an intuitive process to visualize business operations effectively.
How Flow Charts Fit Into Workplace Tools
In a modern business environment, where quick access to up-to-date information is vital, the role of flow charts extends beyond simple visualization. They integrate into tools for charting, providing visual status indicators that align with project timelines. Within a dashboard, flow charts can be crucial for:
- Project Approvals: Clearly mapping out the steps, required sign-offs, and responsibilities.
- Employee Management: Enabling managers to quickly communicate procedural changes or expectations.
- Status Tracking: Offering real-time updates on the progress of various operations.
Flow charts facilitate improved communication among teams by providing a shared viewpoint of ongoing projects or processes.
Enhancing Team Communication with Shared Dashboards
A collaborative dashboard fueled by SharePoint helps teams communicate effectively and mitigate misunderstandings. When each member can access the same visual data, it promotes a unified understanding of objectives, timelines, and each individual's role. These shared dashboards act as a central hub for information, drastically reducing the time spent retrieving status updates or clarifying tasks.
Setting Up in SharePoint with Ease
The setup of these dynamic flow charts in SharePoint is uncomplicated due to the templates available at SharePointDashboards.com. By using a simple copy and paste technique, organizations can quickly deploy powerful visual tools that enhance clarity and performance across departments. With more than 35 different charting templates available and 21 free templates to get started, organizations can easily find the right solution to fit their unique needs.
Use Cases for Flow Charts
Consider several scenarios where these flow charts could be utilized to deliver critical updates:
- A manufacturing team might use flow charts to streamline production processes, ensuring that each segment of the process is clearly defined and visible to all team members.
- Project managers in a software development company can use flow charts to outline project milestones and dependencies, keeping everyone aligned with the project timeline.
- HR departments might use them to visualize employee onboarding processes, ensuring all required actions and verifications are completed efficiently.
Each scenario emphasizes how flow charts can guide teams towards achieving enhanced clarity and operational efficiency.
Leveraging SharePoint JSON Formatting
JSON formatting is a powerful feature within SharePoint that can be used to further customize list view displays. By applying JSON templates to a SharePoint list view, the appearance of the list can be radically transformed to match specific visualization goals. With a foundation provided by SharePointDashboards.com templates, users can employ JSON to tweak layouts and ensure that data is presented in a compelling and useful manner.
Conclusion
Flow charts are an invaluable addition to any organization's toolkit, providing clarity and direction in every process they illustrate. Implementing these within SharePoint using templates from SharePointDashboards.com simplifies this task, providing businesses with vital visual aids to enhance team communication. By customizing and integrating these tools seamlessly into a collaborative dashboard, businesses stand to gain a significant edge in managing projects and operations more effectively. Whether for project approvals, employee management, or status tracking, flow charts within SharePoint deliver unparalleled value across various business functions.