Introduction to Grouped Bar Charts in SharePoint
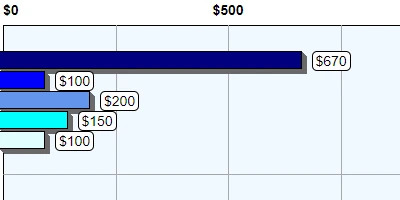
A grouped bar chart is a powerful tool for comparing data trends across different categories. Imagine having the ability to combine several bar charts into one coherent visual representation, which allows you to analyze different data sets alongside one another effortlessly. While SharePoint provides a robust enterprise collaboration platform, it doesn't natively offer advanced charting capabilities such as grouped bar charts. Power BI, a product designed for advanced analytics and data visualization, does offer this feature, but it is often expensive and time-consuming to set up. For organizations looking for a quick, cost-effective solution, SharePoint Dashboards offers a viable alternative. Their Grouped Bar Chart Template, along with 35 other charting templates, can be easily integrated into SharePoint for enhanced data visualization without the need for software installation.
The Role of Grouped Bar Charts in Charting and Data Visualization
Grouped bar charts offer a visual mechanism for data comparison across multiple categories. By displaying information side-by-side, teams can quickly gauge differences and similarities, essential for making informed decisions. This capability plays a pivotal role not only in charting but also in various aspects of project management, such as:
- Visual Status Indicators: Grouped bar charts can be used as status indicators to reflect the health of different projects, tasks, or even the overall performance of a team.
- Project Approvals: By representing data visually, project stakeholders can swiftly understand whether a project meets predefined criteria, expediting the approval process.
- Employee Management: Organizations can use grouped bar charts to monitor team or individual performance, recognizing areas that need improvement or those that are excelling.
- Status Tracking: Helps in tracking progress over time, ensuring that any deviation from the planned trajectory is noticed promptly.
The capability to quickly render business data in formats which speak to an organization's internal stakeholders is a great asset. A well-crafted grouped bar chart allows decision-makers to extract insights and make timely, well-informed decisions.
Improving Team Communication with a SharePoint Dashboard
One of the biggest challenges faced by modern teams is effective communication, especially when data is involved. A shared dashboard on SharePoint ensures that all team members view the same set of data, fostering a single source of truth. By utilizing tools like SharePointDashboards.com, teams benefit in several ways:
- Centralized Information: All relevant data types are available in one location, reducing the chances of miscommunication or outdated information.
- Collaborative Insight: Interactive charting allows team members to discuss insights within the context of visible data.
- Accessibility: Information on the dashboard is accessible to everyone involved, irrespective of location, aiding in collaboration among remote teams.
These dashboards enable every team member to stay updated with the critical information shared by colleagues, enhancing overall team productivity and responsiveness.
Setting Up Dashboards in SharePoint: A Step-By-Step Guide
With SharePointDashboards.com, setting up a custom dashboard in SharePoint is straightforward. Follow these steps:
- Visit SharePointDashboards.com and configure your chosen chart template according to your business needs.
- Use the copy feature to capture your dashboard settings.
- Paste the settings directly into your SharePoint site to deploy your dashboard seamlessly.
This practical solution does not require any software installations, making it incredibly user-friendly, even for those without technical expertise. New users can explore initial solutions with 21 free charting templates, broadening their visual arsenal without financial investment.
Use Case Scenarios: Real-Time Updates with Grouped Bar Charts
Consider scenarios where a finance department must keep track of expenses categorized by department and quarter. A grouped bar chart can dynamically illustrate spending trends, enabling finance leads to compare departments effectively. In another scenario, a sales team might use a similar chart to assess performance across different product lines, visualizing units sold, and revenue generated.
Moreover, marketing teams that conduct multiple campaigns can use grouped bar charts to compare the results of each marketing channel and decide which initiatives need more or less investment. These practical applications demonstrate the diverse utility of such charts in complementing day-to-day business activities.
Understanding SharePoint JSON Formatting for Enhanced Visualization
SharePoint JSON formatting provides an avenue to further customize list views, enhancing the presentation by applying complex styles to specified fields. By altering the JSON properties of list views, different visualization patterns can be adopted.
In the context of SharePointDashboards.com, templates provided can be applied directly; preset JSON scripts simplify the process, transforming ordinary lists into dynamic, aesthetically pleasing data displays with minimal effort. As users become more familiar with JSON formatting, they can modify and refine views to meet evolving organizational needs.
Conclusion
Integrating grouped bar charts through a SharePoint Dashboard not only enables comprehensive data visualization but also revolutionizes internal communication, fosters transparent reporting, and enhances collaborative decision-making. By employing resources from SharePointDashboards.com, including ready-to-use templates, organizations can harness these benefits efficiently and economically. As companies increasingly become data-driven, the importance of accessible, effective visualization tools becomes paramount, ensuring informed decision-making processes are both accelerated and accurately executed.